Majors overlay
The majors overlay draws three kinds of significant market activity directly on a chart, at the exact price each one printed at:
| Layer | What it marks |
|---|---|
| Major trades | Individual trades in the top 10% by size for that symbol |
| Clusters | 1-minute price levels that absorbed far more volume than a typical level on that coin |
| Liquidations | Forced position closes of $5,000 or more |
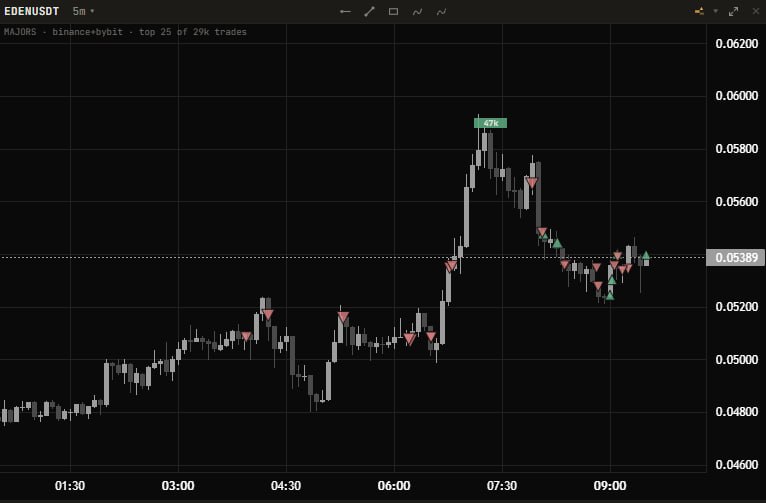
It is a reading aid, not a scanner: it tells you where the size went on a chart you are already looking at.
Turning it on
The overlay is per chart, not global. Each chart has a majors button in its toolbar, and the caret beside it opens the layer menu.
You can also press the overlay key — M by default — while the pointer is over a chart. The key is rebindable in the Home tab as Majors overlay key, next to the drawing-tool keys.
| Tool | Where the overlay is available |
|---|---|
| Analyzer | Every chart panel, and fullscreen |
| Knives | Fullscreen only |
| Monitor | Fullscreen only |
Knives and Monitor limit it to fullscreen deliberately — a ticker card is far too small for per-price markers to be readable.
Un-ticking every layer switches the overlay off
If you turn off all three layers, the overlay itself turns off rather than staying lit and drawing nothing, so the buttons always reflect what you can actually see. Turning it back on re-enables all three.
Reading the markers
Major trades — triangles
A triangle points the way the aggressor pushed: up and green for a buy, down and red for a sell. Its size scales with the trade's dollar value relative to the largest trade currently on screen, so the biggest print in view is always the biggest triangle.
Hovering one shows the side, dollar size, price, percentile, venue and time.
What the percentile means
Each trade carries the percentile it sat at when it printed. Thresholds are recomputed per symbol over a rolling 4-hour window, so p99 means the trade was in the top 1% at that moment — not relative to today.
Clusters — filled cells
A cluster is a one-minute price level that held far more volume than a typical level on that coin. It is drawn as a filled cell at that price, with the volume printed inside.
- Colour — the dominant side: green if buys outweighed sells, red otherwise.
- The number — that dominant side's volume, not the delta.
- Opacity — relative to the loudest level currently visible, so the scale re-normalises as you zoom instead of being flattened by one off-screen giant.
Hovering shows total, buy, sell, delta, and the spot split where spot volume exists.
"no clusters — price too stable" is not a fault
Levels are about 0.05% wide — roughly $55 on BTC. A quiet BTC minute does not travel that far, so the whole minute sits inside one level and nothing can stand out against its neighbours.
Very stable, very expensive coins can legitimately have no clusters at all. The overlay says so in its status line rather than looking broken on the most-watched symbol there is.
Liquidations — diamonds
A diamond marks a forced position close, sized by notional value.
The colour follows the pressure, not the word. A liquidated long is a forced sell, so it is drawn red and downward; a liquidated short is a forced buy, drawn green. This is the easiest thing here to read backwards, and it matches the liquidation tape in the Alerts window.
Hovering spells it out in words — long closed → forced sell — along with size, price, venue and time.
The status line
The overlay writes one line above the chart. It is deliberately honest about every limit rather than silently showing a partial picture:
MAJORS · binance+bybit · top 25 of 29k trades| Fragment | Meaning |
|---|---|
MAJORS · binance+bybit | Markers always come from Binance and Bybit, whatever exchange the candles are |
candles <exchange> | Shown when the candles are from a different venue than the markers |
candles spot | Shown when you are viewing a spot chart |
top N of M trades | The window held M, only the biggest N are drawn — see Markers drawn |
no clusters — price too stable | Explained above |
14d max | The timeframe reaches further back than the server keeps |
connecting… / feed error / no data for this symbol | Connection state |
Markers come from Binance and Bybit only
The feed covers Binance and Bybit linear USDT/USDC perpetuals. If you are charting Gate.io, OKX or Hyperliquid, the candles are that exchange's but the markers are not — the status line says so. Warden never blanks the overlay silently.
History reaches back 14 days. On a timeframe wide enough to outrun that, the left part of the chart simply has no markers, and the line says 14d max.
Settings
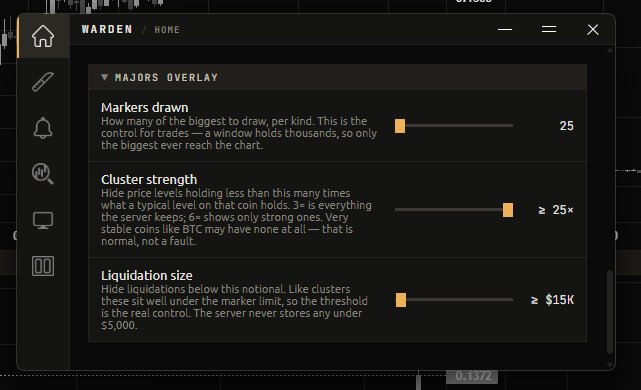
The three filters live in the Home tab, under Majors overlay. They apply to every chart in every tool.
Markers drawn
How many of the biggest to draw, per kind. Range 25 to 1500 in steps of 25, default 200.
This is the control for trades. A busy window holds thousands of them, so only the biggest ever reach the chart — and the status line tells you when that truncation happened.
It rarely matters for clusters and liquidations: there are usually far fewer of those than the limit, so their size thresholds below are what actually decides what you see.
Cluster strength
Hides price levels holding less than this many times what a typical level on that coin holds. Range 3× to 25× in 0.5 steps, default 3×.
- 3× is everything the server keeps — the loosest setting possible.
- 6× shows only clearly strong levels.
Raising it is the fastest way to quieten a noisy chart without losing the levels that matter.
Liquidation size
Hides liquidations below this notional. Range $5,000 to $1,000,000 in $5,000 steps, default $5,000.
$5,000 is the server's own floor — nothing smaller is ever stored, so the minimum setting is already "everything there is".
Related
- Charts & drawing — candle colours, drawing tools and the key bindings the overlay key sits beside
- Analyzer — the tool where the overlay is available on every panel