Alerts
Alerts watches for two things at once and shows them in a single feed:
- Price deviation — the same asset priced differently on different exchanges right now.
- New listings — a token that just started trading on a monitored exchange.
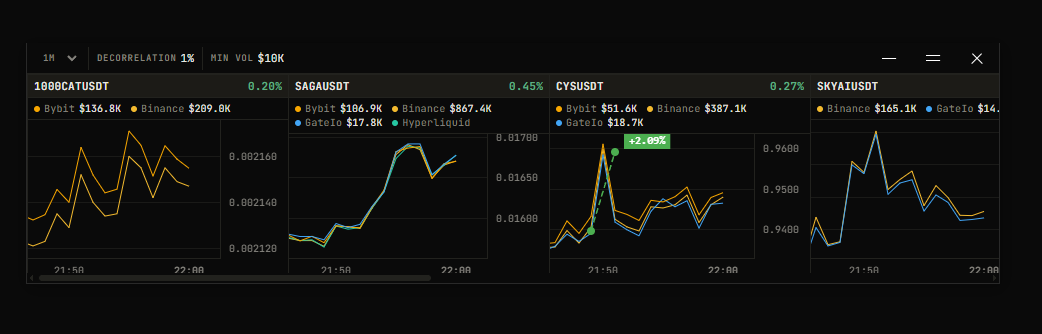
Reading the window
Cards are ordered newest first, by when they first appeared. A card keeps its position as its numbers update, so the feed does not reshuffle under you while you're reading it.
A deviation card
- Symbol — click to copy it to your clipboard; briefly reads
Copied!. - Spread — the live maximum price spread across exchanges, as a percentage.
- Legend — one entry per exchange holding the ticker: a colored dot matching its line on the chart, the exchange name, and its volume. Hovering an entry shows that exchange's exact price and volume.
- Mini chart — one price line per exchange, so you can see whether the gap is opening, closing, or holding.
How the spread is calculated
The percentage is (highest price − lowest price) ÷ lowest price × 100, taken across every exchange currently reporting that ticker.
This figure is live. It is recomputed continuously from the same exchange websockets that feed the chart lines and refreshed about twice a second, so it tracks the current gap rather than the gap at the moment the alert fired.
A spread is not a guaranteed profit
The number is a difference between two quoted prices. It says nothing about whether you could actually trade it — order book depth, fees, funding, transfer time and withdrawal availability are not part of the calculation, and a visible gap can close before an order fills. Treat it as a signal to look, not a result.
The chart is deliberately zoomed in with tight price margins, because the gap between exchange lines is usually small relative to the price and would be invisible at a normal scale.
A new listing card
Listing cards look different from deviation cards: a NEW tag, the symbol (also click-to-copy), and the listing time. They share the feed and the same card limit as deviation alerts.
Settings
Open the Alerts tab in the main window.
Display
Max cards
How many cards the feed shows at once. Range 3 to 50, default 9.
The limit is applied after deviation and listing alerts are merged and sorted, so both types compete for the same slots.
Chart timeframe
The candle interval used for the price lines inside deviation cards. Options: 1m, 5m, 15m, 30m, 1h, 4h, 1d, 1w. Default 1m.
This only changes the chart. It does not change how the spread is calculated or which alerts qualify.
Alert settings
Minimum decorrelation
The spread a ticker must reach before it produces an alert. Range 1% to 10% in 0.5% steps, default 1%.
Alerts don't disappear when the gap closes
Once a ticker passes the threshold it stays in the feed and keeps updating, even if its live spread later drops back below the minimum. The threshold controls what gets in, not what stays.
Notifications
Alert sound
Plays a sound when a new deviation alert appears. On by default.
Listing alert sound
Plays a sound when a new token is listed. On by default.
The two are independent — you can have listings audible and deviations silent, or the reverse.
Volume filter
Enable volume filter
Filters deviation alerts by trading volume. Off by default.
It takes two
A deviation alert needs at least two exchanges above the minimum volume to pass the filter. That is deliberate: a price gap is only meaningful if both sides of it have real trading behind them.
This filter applies to deviation alerts only. New listing alerts are not filtered by volume — a token that just listed has no meaningful volume history.
Minimum volume
The 5-minute volume, in USD, an exchange needs for its side of a deviation to count. Range $10K to $1M in $10K steps, default $10K.
Greyed out unless the volume filter is enabled.
Liquidation tape
Alerts can also carry a live tape of forced position closes — a separate feed from the deviation and listing cards, shown in its own strip alongside them.
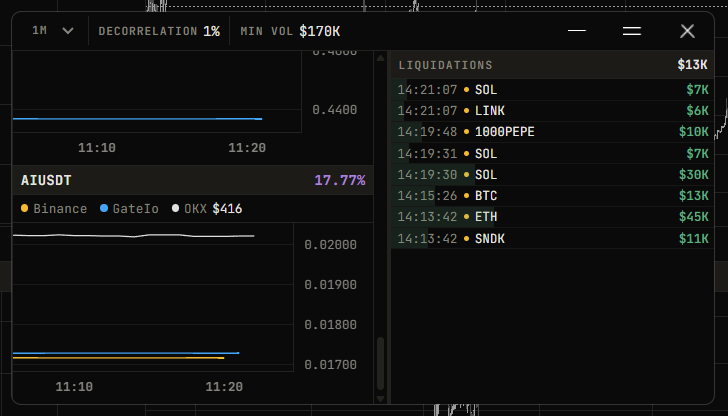
It is off by default. A client that never enables it receives no liquidation messages at all.
Reading the tape
The header shows LIQUIDATIONS and, when anything has arrived recently, a running figure — the total liquidated in the last 60 seconds.
Each row is one event, newest at the top:
| Part | Meaning |
|---|---|
| Time | When it printed |
| Coloured dot | Which exchange, in that exchange's colour |
| Symbol | With the USDT / USDC suffix stripped |
| Amount | Notional value of that single liquidation |
The row's background bar scales with size, so big events are visible without reading the number. Click a row to copy its symbol.
Hovering spells the event out — venue, long liquidated → forced sell or short liquidated → forced buy, quantity and price.
Colour follows the pressure, not the word
A liquidated long is a forced sell; a liquidated short is a forced buy. The tape colours by that resulting pressure, matching the liquidation diamonds in the majors overlay.
Before the first event arrives the tape reads waiting… rather than sitting blank.
Moving and resizing it
Drag the LIQUIDATIONS header to dock the tape to any edge — left, right, top or bottom. Left and right give a column of rows; top and bottom give a horizontal strip. Default is right.
Drag the gutter between the tape and the cards to resize it.
If you shrink the window far enough the tape hides itself rather than crowding out the alert cards.
Settings
Open the Alerts tab in the main window.
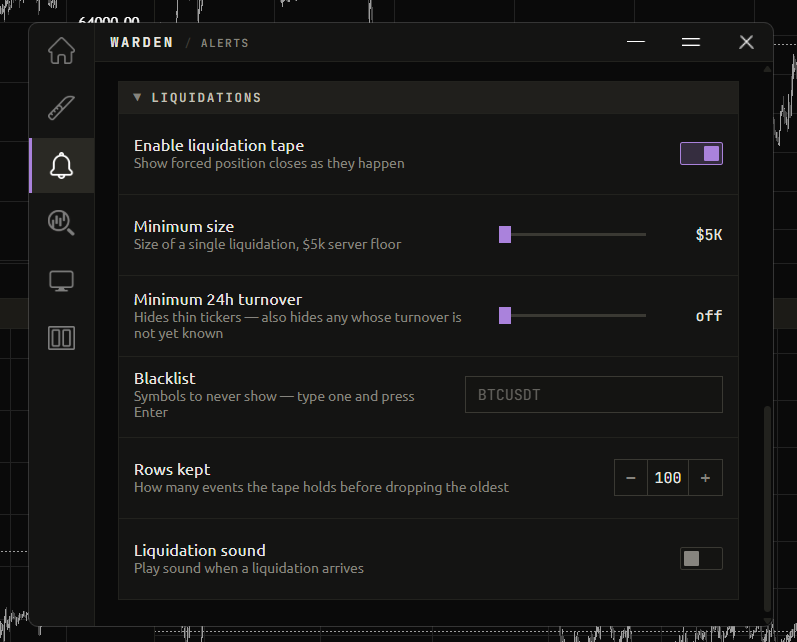
Enable liquidation tape
Shows forced position closes as they happen. Off by default — everything below is inert until this is on.
Minimum size
The size of a single liquidation, in USD. Range $5,000 to $1,000,000 in $5,000 steps, default $50,000.
$5,000 is the server's own floor: nothing smaller is stored, so the minimum setting already means "everything there is".
Minimum 24h turnover
Hides thin tickers by their 24-hour turnover. Range $0 to $50M in $1M steps, default 0 — shown as off, meaning no filtering.
A non-zero value also hides unknown tickers
Any symbol whose 24h turnover is not yet known is hidden too, not just the genuinely thin ones. On a freshly opened window that can mean noticeably fewer events until turnover figures are in.
Blacklist
Symbols to never show. Type one and press Enter to add it; Clear all empties the list.
Useful for the handful of tickers that liquidate constantly and would otherwise dominate the tape.
Rows kept
How many events the tape holds before dropping the oldest. Range 20 to 300 in steps of 20, default 100.
Liquidation sound
Plays a sound when a liquidation arrives. Off by default.
Note that this fires on every event that passes your filters — with a low minimum size on a busy market that is a lot of sound. Raise Minimum size first, then turn this on.